
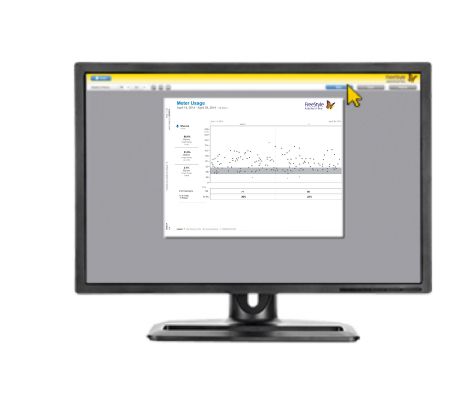
The Meter Usage report provides a history of blood glucose readings, including daily percentages of readings that were within a specified target range (defined by your facility or administrator).
FreeStyle Auto-Assist Neo Software
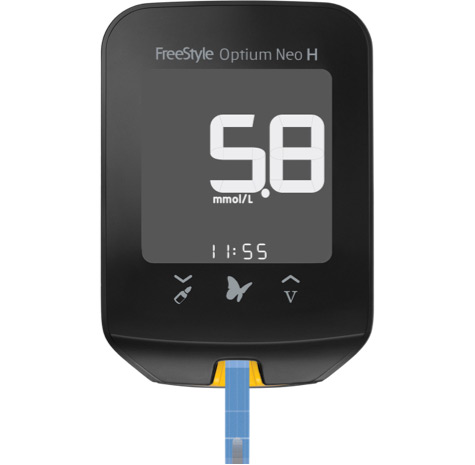
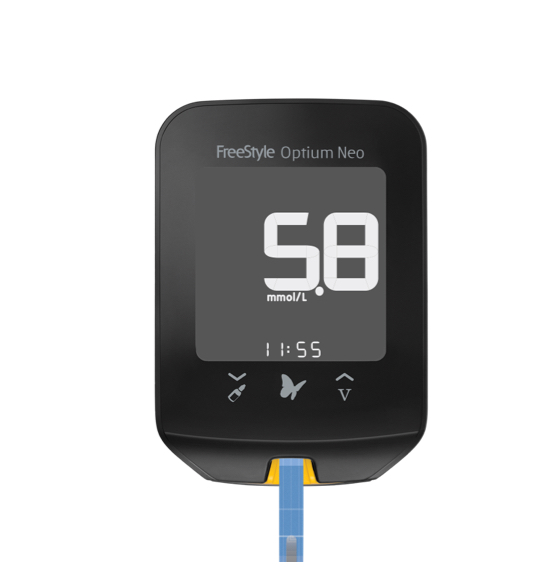
Easy-to-use software to help you and your patients get the most out of the FreeStyle Optium Neo and FreeStyle Optium Neo H Blood Glucose and Ketone Monitoring Systems.
What does the software do?
When used with the FreeStyle Optium Neo H Meter
Healthcare Professionals can view and print reports and configure the settings for the meter.
Getting started
-
Download the FreeStyle Auto-Assist Software
Compatible operating systems: Windows XP (Service Pack 3), Windows 7 (32 or 64 bit) and Windows 8 (32 or 64 bit). At a minimum, a computer with a USB 2.0-compliant hub with a dual-core 2.4 GHz processor and 2GB RAM is required. Read the User’s Guide for further info.
-
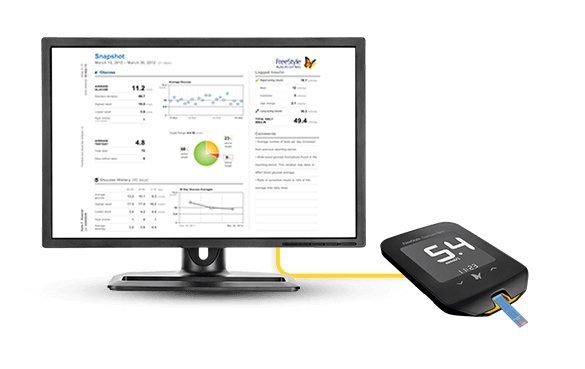
Connect the meter
A USB cable is provided with the system kit. Plug one end into the USB port on the meter and the other end into the USB port on the computer.
-
Set time and date
You may be asked to update the time on the meter when it is connected to the FreeStyle Auto-Assist Software. When you click Update, the meter time will change to match the current time on the computer.

How to use the software
Creating, printing and saving reports
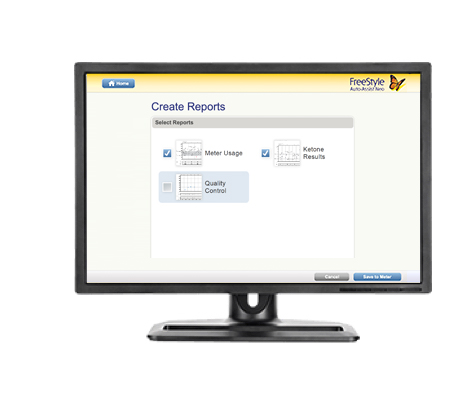
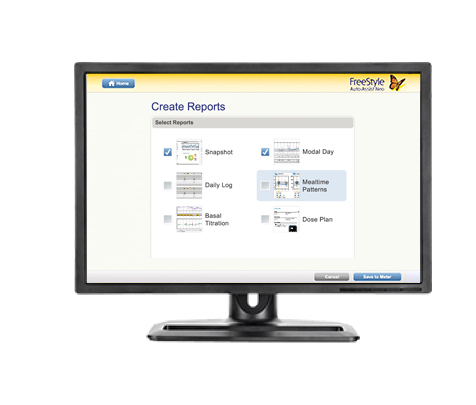
Creating reports
-
The Create Reports screen lets you select reports and set report parameters. Selected reports can be viewed, printed and saved as a PDF. The most recent parameters will be saved.
-
Parameters
The timeframe selects the date range that will be used for all reports. You can select the last 1 to 4 weeks, or you can select a custom start and end date. The target glucose range is the range specified by your facility or administrator and is used to calculate the number of test results within the specified range.
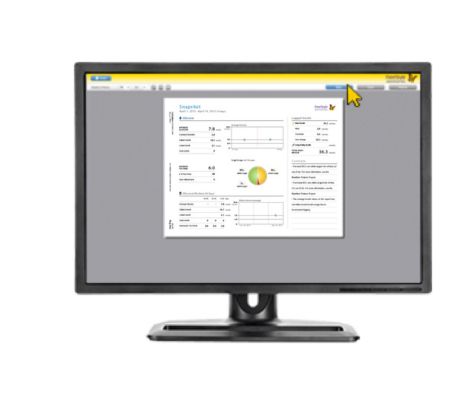
Printing, Viewing & Saving Reports
When the report parameters are set, you can choose to Print or View the reports.
-
The software will display a print window. Confirm the printer settings, then select Print.
-
Navigate through the reports to view them on screen either by selecting the report name from the drop-down menu or by clicking through the pages.
-
The arrow, plus and minus buttons can be used to fit the report within the window, zoom out and zoom into the report on the screen.
-
The Back button goes back to the Create Reports screen. Report parameters can then be changed and the reports can be viewed again.
-
The Save button prompts you to save the reports to the computer as a PDF
-
The Print All button opens the standard print window to allow printing.
Report overview
In order to create reports, the meter must be connected to the computer.
AVAILABLE REPORTS:
Meter Usage Report

Quality Control Report

The Quality Control report gives a view of control solution tests and calibrations for the specified period of time.
Ketone Results Report

The Ketone Results report provides a report of blood ketone test results within a specified timeframe.
What does the software do?
When used with the FreeStyle Optium Neo Meter
Patients can generate, view and print reports and change their meter settings.
Healthcare professionals can generate, view and print reports and configure the insulin settings that the patient will see on the meter.
Getting started
-
Download the FreeStyle Auto-Assist Software
Compatible operating systems: Windows XP (Service Pack 3), Windows 7 (32 or 64 bit) and Windows 8 (32 or 64 bit). At a minimum, a computer with a USB 2.0-compliant hub with a dual-core 2.4 GHz processor and 2GB RAM is required. Read the User’s Guide for further info.
-
Connect the meter
A USB cable is provided with the system kit. Plug one end into the USB port on the meter and the other end into the USB port on the computer.
-
Set time and date
You may be asked to update the time on the meter when it is connected to the FreeStyle Auto-Assist Software. When you clike Update, the meter time will change to match the current time on the computer.
How to use the software
Creating, printing and saving reports
Creating reports
-
The Create Reports screen lets you select reports and set report parameters. Selected reports can be viewed, printed and saved as a PDF. The most recent parameters will be saved.
-
Parameters
The timeframe selects the date range that will be used for all reports. You can select the last 1 to 4 weeks, or you can select a custom start and end date.
The target glucose range is displayed on some glucose graphs and is used to calculate your patients' time in target.
Blood glucose levels that are below the low glucose threshold will be specifically marked on the reports by either a red down arrow, or the glucose value will be outlined in red.
Pre-meal target is the target blood glucose level for readings immediately before a meal. The mealtime patterns report uses this for comparing readings with the desired range.
Post-meal target is the target blood glucose level for readings 1, 2 or 3 hours after a meal. The mealtime patterns report uses this for comparing readings with the desired range.
Printing, Viewing & Saving Reports
When the report parameters are set, you can choose to Print or View the reports.
NOTE: A name or patient ID must be added to the User Profile in order to Print or View reports.
-
The software will display a print window. Confirm the printer settings, then select Print.
-
Navigate through the reports to view them on screen either by selecting the report name from the drop-down menu or by clicking through the pages.
-
The arrow, plus and minus buttons can be used to fit the report within the window, zoom out and zoom into the report on the screen.
-
The Back button goes back to the Create Reports screen. Report parameters can then be changed and the reports can be viewed again.
-
The Save button prompts you to save the reports to the computer as a PDF
-
The Print All button opens the standard print window to allow printing.
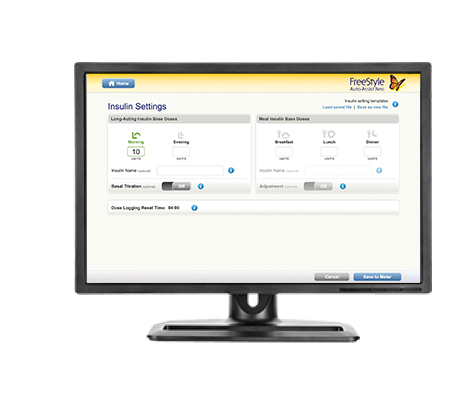
Insulin settings
To use the insulin features, healthcare professionals must first set up Insulin Settings with an access code.
-
Click Insulin Settings on the Home Screen
-
Click Set Up Insulin
If insulin settings have already been configured on the meter, the button will say Edit Insulin.
-
Enter the access code when prompted.
Once the access code has been entered, a healthcare professional may begin to configure Insulin Settings. When complete, click Save to Meter.
CAUTION: Abbott Diabetes Care provides the access code to healthcare professionals only. The set up of this feature is intended for healthcare professionals only who have an understanding of insulin use. Misuse or misunderstanding of this feature may lead to inappropriate insulin dosing.
Report overview
In order to create reports, the meter must be connected to the computer.
AVAILABLE REPORTS:
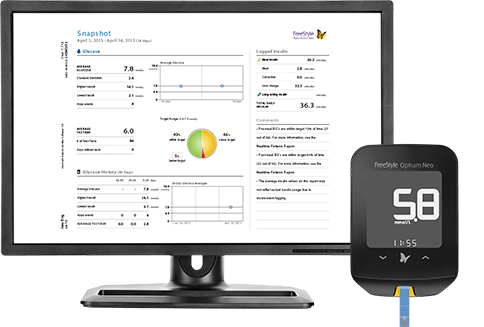
Snapshot Report

The Snapshot report is a general summary of data for the specified date range. It also includes notes to inform patients and their healthcare professionals about important trends in blood glucose data by putting the data into words. Up to 6 notes are displayed at one time.
Modal Day Report

The Modal Day report shows the daily pattern of blood glucose results over a specified date range along with total insulin doses, type of insulin used (basal or rapid-acting).
Daily Log

The Daily Log provides a table of blood glucose readings, results and other values, such as ketone test results and logged insulin doses for each day in a specified date range.
Insulin doses are only available if logged in the meter.
Basal Titration Report

The Basal Titration report compares fasting blood glucose levels with long-acting insulin doses over a 12-week period.
The report also shows when long-acting insulin doses have been adjusted based on fasting blood glucose trends.
Mealtime Patterns Report

The Mealtime Patterns report compares the before-meal and after-meal blood glucose levels for breakfast, lunch and dinner, over the specified date range. This report also shows before-and-after meal averages and logged insulin.
Dose Plan

The Dose Plan report shows all current insulin settings on the meter.
Note: Patients should always consult their healthcare professional if they have any questions or concerns about their diabetes management or results.
ADC-63814 v5.0